Breaking Videogames
For those who can't play a video game without dissecting it
Project maintained by banyaszvonat Hosted on GitHub Pages — Theme by mattgraham
Sorry for the quiet. I haven’t forgotten about the blog, in fact I decided to look into something and I encountered an annoying bug with radare2+iaito, so I switched to rizin+cutter for the time being. This is a short post about a basic trick that is rapidly becoming one of my favorites.
Normally, when an application is compiled for release, one of the differences compared to debug builds is that the names of the symbols (functions, variables, etc.) are “stripped”, i.e. removed from the compiled executable.
Symbol names are text strings meant to identify a function to humans writing or debugging the application. To simplify things, since the OS only needs the address of a function to call it[^1], such names are extraneous. Presumably, symbols are also stripped from release builds because of people like me (reverse engineers.)
What all this means is that when you load up an executable in your tool of choice, it usually looks like this:
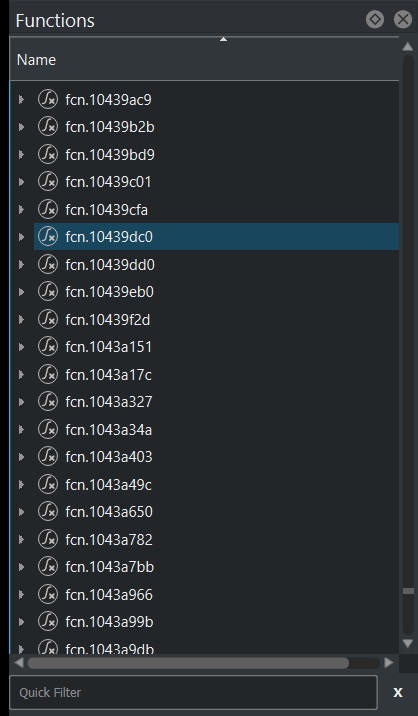
As I mentioned, functions are called by their address, so might as well identify them by that.
But symbol names aren’t the only debugging feature. For example: a developer may want the code to report a unusual event, or dump some extra information when a unusual event happens, on a separate channel. When in a release build, these may be prevented from being compiled-in in the first place, or replaced with a no-op. But depending on the particulars, it’s not unusual for strings pertaining to these debug messages (and the messages themselves) to be left in the application.
Something like that is what we have here:
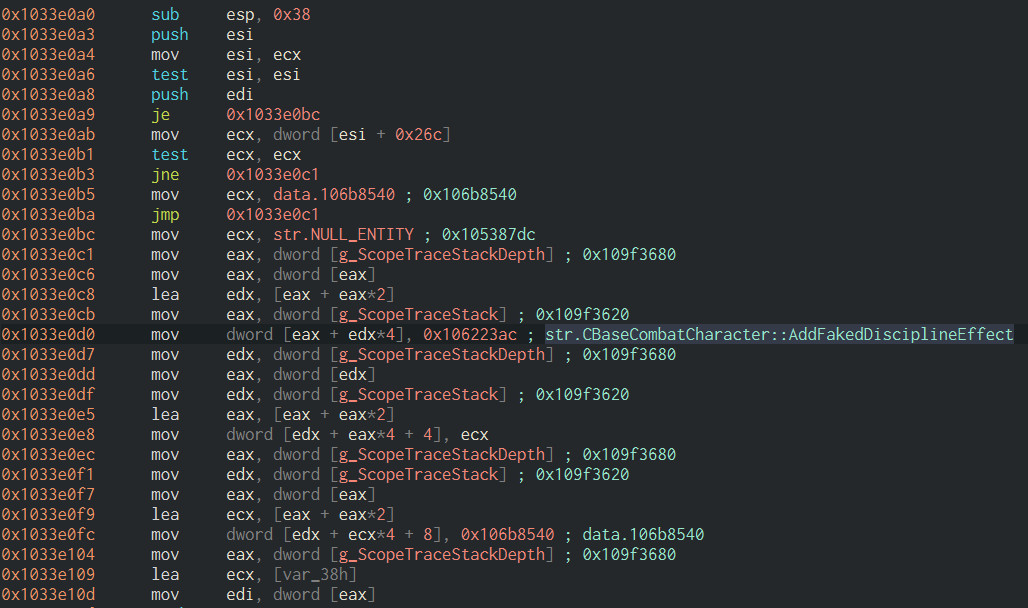
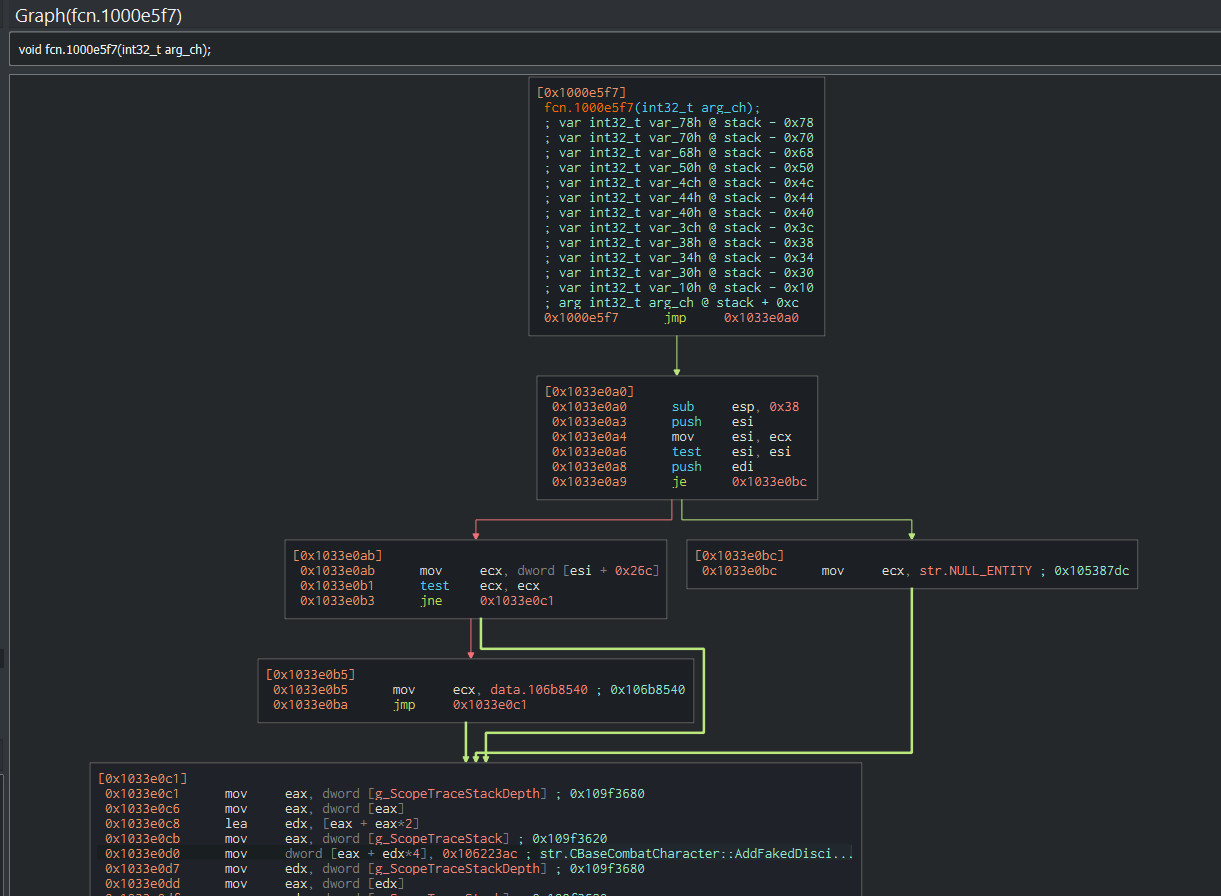
Helpfully, r2’s autoanalysis filled in the global variable names, and even noticed the string being loaded. Based on that, it’s possible to tell this is part of some sort of facility that records stack traces. Likely, it’s to aid debugging the game engine at runtime. But the same information also helps us with static analysis, since it contains the symbol’s former name. Switching to graph view shows us the function containing it.
In summary: even though the binary is stripped, by inspecting strings contained in the application, and what refers to them, some symbols could be recovered from code maintaining an in-engine stack trace. While the particular function with a debug string that inspired this post was found randomly, in this example functions’ names can reliably be found by inspecting which functions load the particular debug string. This gives a headstart with reverse engineering, since it provides something to get oriented by, closer to the actual functionality of interest.
There are also calls to a DevMsg function, but that’s potentially for a later post.
[^1] The simplification I’m making is ignoring the intricacies of linking and all the things that need to happen before you can just call 0xf00b447